 ROMANA
The ECG analysis
 The Analgesia Nociception Index calculation relies on the acquisition of R-R series which allows to measure the influence of respiration on the heart rate: this influence is related to a brief parasympathetic tone increase associated with each respiratory cycle. The result is a shortening of R-R intervals during inspiration, which is expressed by respiratory sinus arrhythmia. The clinical value of respiratory sinus variability analysis appeared in 1965 when Hon and Lee noticed that fetal distress is preceded by a modification of the R-R intervals before a heart rhythm alteration itself. Towards 1970, Ewing and coll developed simple tests using variations of R-R intervals on short periods to detect dysautonomia in diabetic patients. In 1977, Wolf and coll showed that the respiratory sinus variability reduction after myocardial infarction was associated with a decrease of the patients survival. In 1981, Akselrod and coll, were the first to use spectral analysis of the R-R series to quantify the cardiovascular control.
From ECG to ANI®
 The « short term » fluctuations of heart rate reflect the influence of the sympathetic and parasympathetic systems.
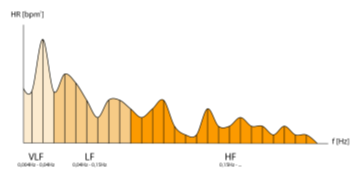
The modulation of instant heart rate caused by the opposite effects of sympathetic and parasympathetic nervous systems is measurable by spectral analysis : the high frequency component (HF) [0.15 – 0.4 Hz] is only related to paraS system, while the low frequency component (LF) [0.05 – 0.15 Hz] is under the influence of sympathetic and paraS systems ; thermoregulation and baroreflex influence LF, and the very low frequencies [0.004 – 0.05 Hz].
The breathing movements represent a significiant part of the HF of heart rate variability, whose effects on heart rhythm are described as “Respiratory Sinus Arrhythmia”: the heart rhythm accelerates temporarily with each breath under the effect of the temporary decrease of the parasympathetic tone.
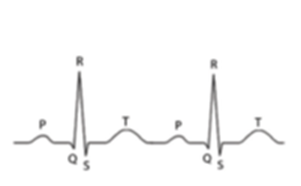
The R wave detection of the ECG signal allows to calculate precisely the time interval between each heart beat (R-R interval) expressed in msec. The RR series are filtered in real time thanks to a detection algorithm to avoid potential artifacts to interfere with the RR serie calculation (e.g. extrasystoles).
Afterward each RR serie is re-sampled at 8 Hz, then isolated in a moving window of 64 seconds. In order to remove the basic heart rate influence of patient, the average value M of R-R intervals from the window is subtracted in each sample : RRi = (RRi – M). In order to make RR series mutually comparable, the RR serie (RRi) – considered as a 512 points vector – is normalized by using its vectorial norm S.
Many studies shew that pain and or anxiety involve a sympathetic activation measurable by Heart Rate Variability (HRV) in the form of an increase of the LF spectral content (sympathetic and parasympathetic) and of a decrease of the HF spectral content (parasympathetic). As a consequence, the RR serie filtering in the frequency range (0.15-0.4 Hz) allows to display the influence region of ventilation in the RR serie, which corresponds to the parasympathetic tone of the patient.
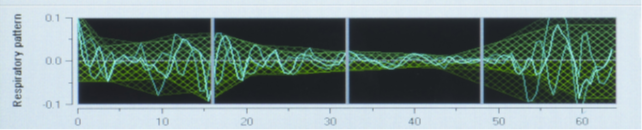
Respiratory pattern of the ANI Monitor
Why use the ANI®
The monitor can be used on two types of patients: unconscious and conscious. In the first situation (unconscious patient under general anesthesia in the operating room), the ANI range [50-70] corresponds to the adequate analgesia area, that is to say the opioids coverage is sufficient, corresponding to a relative parasympathetic tone predominant on the sympathetic tone.
When the ANI value is under 50, the occurrence of a hemodynamic reaction within 10 minutes is very likely (80% of probability when the curve is under 40 and 100% of probability when the curve is under 30). Anesthesists would have a strong interest in re-injecting some opioids to avoid the future hemodynamic reaction.*
In cases where the ANI value would rise above 70, an opioids overdose is probable. Practitioners can avoid an additional injection and reduce opioids overdoses’ side effects:
- longer time of recovery
- nausea, vomitting in PACU
- bradycardia
- respiratory failures
- post operative hyperalgesia
- dizziness
- constipation
- delirium
- hypotension
- hallucinations
- stimulates cancer progression
For WHO?
Elderly people, very sensitive to opioids overdose, to bradycardia risk and to hypotension
Obese patients, whose distribution volumes are modified compared to others. Most of clinicians who are using the ANI® have reduced the opioids doses from 30% to 60% compared to the initial doses delivered to these patients.
Drug addict patients
Long time surgery >3h, to make sure that the opiod titration is personnalized, avoiding the side effects of over and under dosage.